August 7, 2026
Introducing the HoopIQ.ai Game Momentum Chart: See Where the Game Changed
Basketball is a game of runs.
A team scores six unanswered points. The opponent responds with an 8–0 run. A turnover leads to a transition three, the energy shifts, and suddenly a close game begins to pull away.
The final score tells you who won. The new Game Momentum chart from HoopIQ.ai helps you understand how it happened.
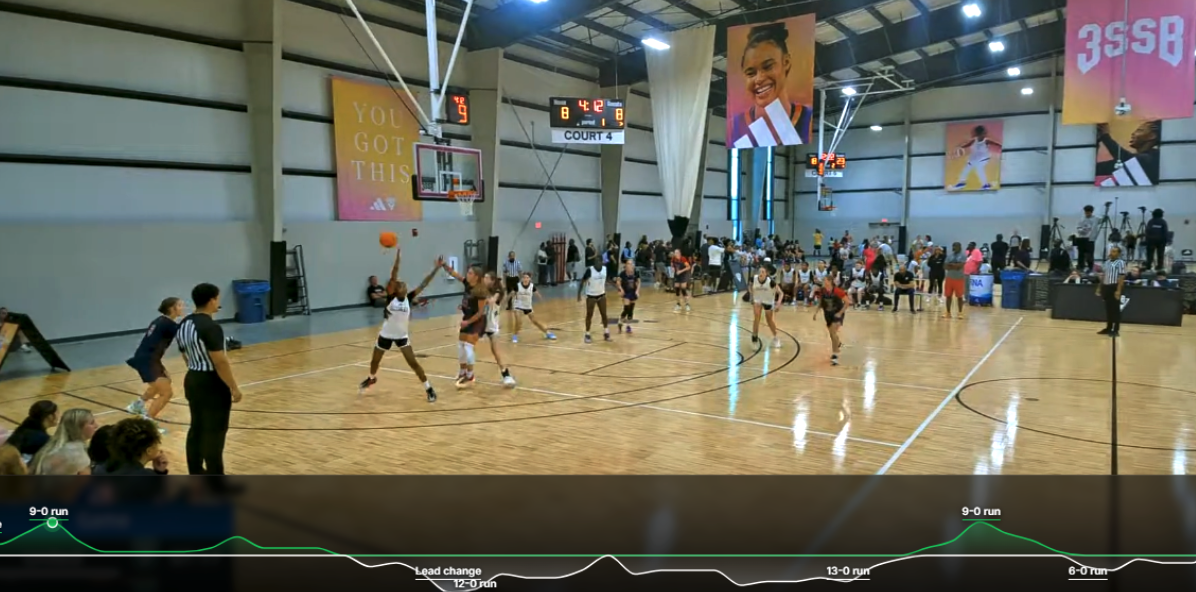
Built directly into the HoopIQ game view, the Momentum chart provides a visual timeline of the game’s biggest runs, lead changes, and momentum swings. Instead of watching the entire game and trying to remember when everything changed, coaches, players, and parents can quickly identify the stretches that had the greatest impact on the outcome.
Why Momentum Matters in Basketball
Basketball games are rarely decided by one play. They are usually decided by a series of possessions.
A missed defensive assignment can lead to an open shot. A rushed possession can create a turnover. That turnover can lead to an easy basket, increased confidence, and another defensive stop. Before long, a two-point game has become a double-digit lead.
The teams that consistently create, extend, and respond to runs usually put themselves in the best position to win.
Understanding those runs is critical because they reveal more than the box score:
When did the game begin to shift?
What lineup was on the floor?
What caused an opponent’s run?
How did the team respond after losing the lead?
Which possessions helped build momentum?
Were the same mistakes repeated during multiple runs?
HoopIQ’s Momentum chart makes those patterns much easier to see.
See the Story Behind the Final Score
The Momentum chart appears along the bottom of the game video and follows the action throughout the game.
Each team is represented visually on the chart, making it easy to see when one team is gaining control. HoopIQ also identifies important moments such as:
Scoring runs
Lead changes
Extended momentum swings
Key stretches in which a team created separation
Opponent responses that brought the game back within reach
The chart transforms a full game into a visual story. Peaks, dips, and labeled runs show where momentum moved from one team to the other and where coaches should focus their review.
How Coaches Can Use the Momentum Chart
For coaches, reviewing game film often means searching through an hour or more of footage to find a handful of meaningful stretches. The Momentum chart provides a faster starting point.
A coach can identify an opponent’s 8–0 run and review the surrounding possessions to determine what caused it. Was the team turning the ball over? Giving up offensive rebounds? Taking rushed shots? Failing to get back in transition? Struggling against a press?
Coaches can also study their own team’s best runs to understand what was working:
Which lineup produced the strongest stretch?
Was the team moving the ball more effectively?
Did defensive pressure create easier offense?
Were players attacking the paint instead of settling for shots?
Did a substitution or timeout change the game?
This makes film sessions more focused and actionable. Instead of telling players that the team “lost control in the second half,” a coach can show them the exact possessions when the momentum changed and explain why.
How Players Can Use It
Players can use the Momentum chart to better understand how their decisions affect the game.
A player may have scored well overall but contributed to an opponent’s run through turnovers, poor shot selection, or missed defensive rotations. Another player may not have scored much but helped reverse momentum by defending, rebounding, moving the ball, or making the right play.
By reviewing the biggest swings, players can ask:
What was I doing when we played our best?
How did I respond when the other team made a run?
Did I stay composed under pressure?
Did I help stop the run or add to it?
What should I do differently the next time this situation happens?
This builds something that traditional statistics cannot fully capture: game awareness.
How Parents Can Use It
For parents, the Momentum chart provides an easier way to understand the flow of the game without needing to rewatch every possession.
Parents can quickly find the most important stretches and review how their player performed when the pressure increased. It also creates a healthier way to discuss performance.
Instead of focusing only on points scored, parents can look at effort, decision-making, defense, rebounding, communication, and how their player responded during a difficult run.
That turns game film into a development tool, not simply a highlight reel.
Learning From the Other Side of a Run
The Momentum chart may be even more valuable after a loss.
When an opposing team puts together a major run, the chart helps pinpoint exactly where the game slipped away. From there, the team can review what happened before, during, and after that stretch.
Perhaps the team failed to stop the ball in transition. Maybe players became rushed after two consecutive turnovers. The opponent may have changed defenses, dominated the offensive glass, or repeatedly attacked the same matchup.
Once the pattern is visible, it becomes coachable.
The goal is not simply to see that the opponent went on a run. It is to understand:
What started the run?
What allowed it to continue?
What could have stopped it sooner?
How should the team respond the next time?
That is how a difficult loss becomes a useful lesson.
How to Use the Game Momentum Chart
Using the Momentum chart is simple:
Open a processed game in HoopIQ.ai.
Go to the main game video view.
Select the Momentum control to display the chart beneath the video.
Follow the chart to locate scoring runs, lead changes, and major swings.
Review the corresponding section of game film and the surrounding possessions.
Compare what happened during your team’s strongest and weakest stretches.
The chart is designed to support film review without overwhelming the screen. When you want an unobstructed video view, simply select the Momentum control again to toggle the chart off. Turn it back on whenever you want to analyze the flow of the game.
Better Game Film Review Starts With Knowing Where to Look
Game film contains the answers, but finding them has traditionally required a great deal of time.
HoopIQ.ai’s Game Momentum chart makes the most important moments easier to locate, understand, and teach. Coaches can run more focused film sessions. Players can see how their decisions affected the game. Parents can better understand performance beyond the box score.
Because the most valuable lesson is not just knowing whether your team won or lost.
It is understanding where the game changed and what you can do differently next time.
Upload your game to HoopIQ.ai and experience the new Game Momentum chart today.